
How to Read a Weather Map: Isobars, Fronts, and Pressure Systems Explained
How to Read a Weather Map: Isobars, Fronts, and Pressure Systems Explained
Weather maps look like a plate of spaghetti dropped onto a map of the country. Almost every squiggle carries a specific message about the air overhead, though, and once you know about six symbols, a glance at the national map tells you more about tomorrow's sky than a forecast icon does. Here's the plain-English version.
The Map Is Really a Pressure Map
Start with what the lines are drawn for: air pressure. A surface map shows the weight of the atmosphere at sea level, measured in millibars (mb) or hectopascals (hPa) — identical numbers, different labels. Standard pressure is roughly 1013 mb, and lines are usually drawn every 4 mb.
Everything else follows from there. Pressure differences create wind. Wind carries heat and moisture. That moving air builds clouds, rain, and thunderstorms. Radar blobs and temperature shading are layered on top, but the pressure pattern underneath drives the show.
Think of it this way: if the pressure were the same everywhere, the atmosphere would be bored and still. It's the highs and lows — the bumps and dips in that pressure field — that set air in motion. A 20 mb difference between a high in Montana and a low in Kansas is enough to generate a stiff, relentless wind across the Plains. That's why meteorologists care so much about those numbers.
Isobars: The Lines That Do the Heavy Lifting
Isobars connect places with equal pressure. Where they bunch together, pressure is changing quickly over a short distance, and air rushes to even things out. That rush is wind. Where they sprawl apart, the air has little reason to move and you get a calm, often hazy day.
Two things to read off the lines:
- Spacing means wind. Widely spaced isobars, light breezes. Tightly packed isobars, a gusty day — and between a strong high and a deep low, a genuinely windy one. As a rule of thumb, if the lines are so close they almost touch, expect winds strong enough to blow your hat off.
- Shape means the story. Closed loops mark highs and lows. Long bulges and dips mark ridges and troughs. Sharp kinks in the lines usually mean a front is running through, and that's where the weather gets interesting.
One detail: near the ground, wind doesn't blow exactly along the isobars. It crosses them at a slight angle toward lower pressure, which is why air spirals into a storm center instead of circling it neatly. Friction with the ground slows the wind and nudges it inward. Higher up, the wind is freer and blows more parallel to the lines.
You can also use isobars to estimate wind speed. The closer the lines, the stronger the pressure gradient force. If you see four isobars packed into a 100-mile stretch, that's a much windier day than one isobar crossing the same distance. This is why coastal areas often see strong winds when a tight pressure gradient sets up between a continental high and an offshore low.
Highs, Lows, Ridges, and Troughs
Big H and L letters mark pressure centers. In the Northern Hemisphere they behave as mirror images of each other.
- High (H): air sinks and spreads outward clockwise. Sinking air dries and warms, which eats clouds. Fair weather, light wind, and a wide swing between a warm afternoon and a chilly night. In winter, expect clear, cold nights and morning fog in river valleys.
- Low (L): air converges and rises counterclockwise. Rising air cools, moisture condenses, and clouds build. Expect gray skies, precipitation, and wind. The deeper the low, the more intense the weather — a 980 mb low is a much bigger troublemaker than a 1005 mb one.
Ridges and troughs are the elongated versions of highs and lows. A ridge is a long arm of high pressure, often bringing a stretch of calm, dry days. A trough is a long arm of low pressure, and it's frequently the trigger for showers and thunderstorms, especially in summer. Think of a ridge as a mountain range of air that blocks storms, and a trough as a valley that invites them in.
In the Southern Hemisphere, the circulation reverses: highs spin counterclockwise, lows spin clockwise. Everything else — the sinking versus rising air, the fair versus foul weather — stays the same.
Fronts: The Battlegrounds of Weather
Fronts are the boundaries between air masses with different temperatures and humidity. They're drawn as lines with triangles or semicircles, and they're often where you'll find the most active weather on the map.
- Cold front: a wedge of cold air pushing under warm air. Shown with blue triangles pointing in the direction of movement. Expect a rapid temperature drop, shifting winds, and often a line of thunderstorms. After it passes, the air feels crisp and clear.
- Warm front: warm air gliding up over retreating cold air. Shown with red semicircles pointing in the direction of movement. Expect a gradual warm-up, increasing humidity, and a long stretch of light-to-moderate rain or drizzle ahead of it.
- Stationary front: a front that isn't moving much, with alternating triangles and semicircles on opposite sides. It can sit in one place for days, producing persistent clouds and rain that lead to flooding.
- Occluded front: a cold front catches up to a warm front and lifts it off the ground. Shown with purple triangles and semicircles on the same side. It often marks the final stage of a storm system, bringing a mix of rain, snow, and wind before the low weakens.
If you see a cold front on the map, check the isobars behind it. Tightly packed lines mean a strong push of cold air and a windy, dramatic passage. A warm front with sprawling isobars is more of a slow, soggy affair.
Putting It All Together: A Sample Map Reading
Imagine a national map on a Tuesday morning. There's a deep L over eastern Colorado, with tightly packed isobars spiraling into it. A cold front trails south from the low, marked with blue triangles. To the west, a sprawling H sits over Utah, with widely spaced isobars. In the Southeast, a warm front stretches eastward with red semicircles.
Here's what you can say without looking at a single forecast model:
- Kansas and Nebraska are in for a windy day, with gusts as the cold front sweeps through. Thunderstorms are likely along and ahead of the front.
- Utah and Nevada will be calm and dry under the high, with a big temperature swing from afternoon to night.
- The Southeast will see increasing clouds and periods of rain as the warm front lifts northward, but the rain will be lighter and more persistent.
- Behind the cold front, in Colorado and Wyoming, skies will clear and temperatures will drop sharply by evening.
That's the power of the pressure map. You don't need to know every detail to get the big picture.
Quick Tips for Reading Weather Maps Faster
- Find the nearest front. That's where the weather is most likely to change in the next few hours.
- Check the isobar spacing. Tight lines mean wind; loose lines mean calm.
- Look at the wind arrows. They show direction and, sometimes, speed. They should roughly follow the isobars, crossing slightly inward toward low pressure.
- Identify the pressure centers. A high to your west often means clearing skies; a low to your west often means storms coming.
- Remember the general motion. In the mid-latitudes, weather systems typically move from west to east, so look upstream for what's coming.
Weather maps are not a perfect crystal ball, but they are a remarkably honest one. Learn to read the pressure, and the rest of the story — wind, rain, sun — writes itself.
Next time you see a weather map, don't be intimidated by the spaghetti. Start with the big H and L, trace the isobars, find the fronts, and you'll have a solid read on what the sky is about to do.
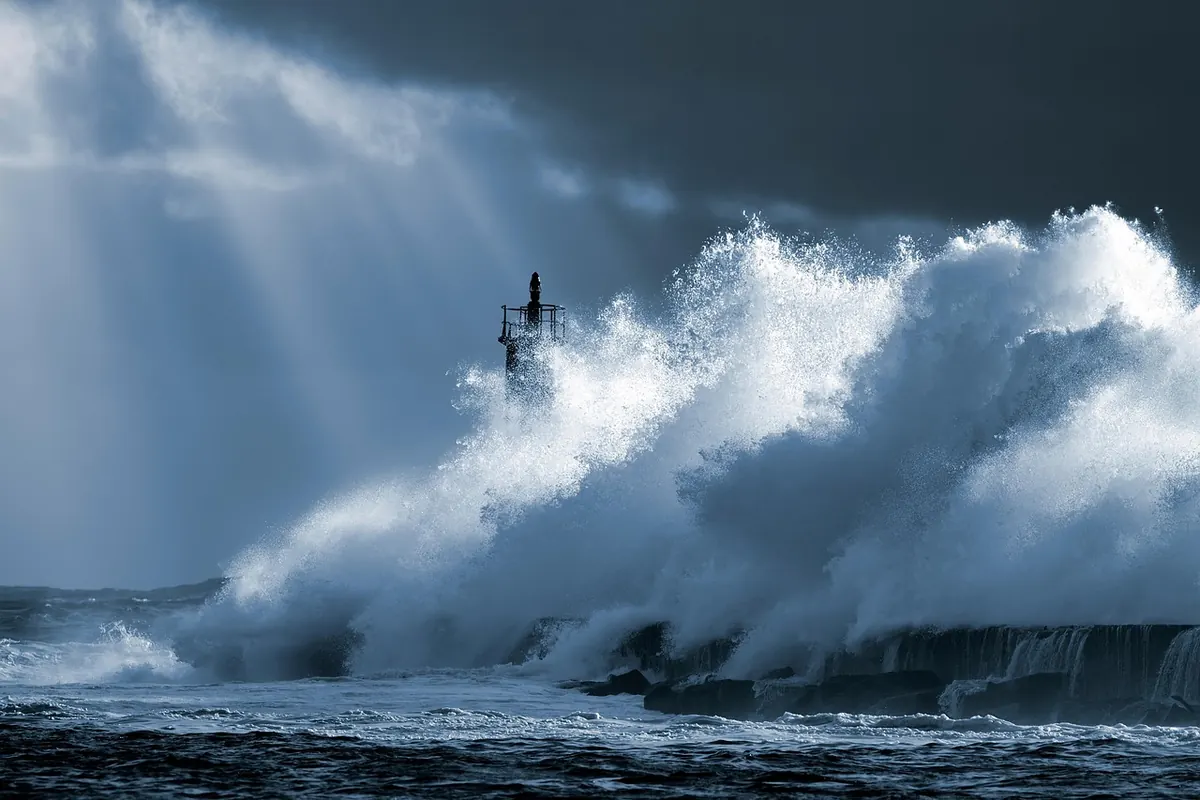
Photo: Horacio30 / Pixabay
You Might Also Like
Woolly bear bands, persimmon seeds, acorn crops and squirrel habits: a field guide to the folk signs said to predict a hard winter, and how to track them yourself.
Six familiar weather sayings, from red skies to thick onion skins, get checked against how weather actually works — and the short-range ones come out far better than the season-ahead ones.